Trade Me Insights is currently available in a beta version to a sub group of test members.
Insights provides buying, selling and demographic data on your Trade Me products and listings. The objective is to help sellers analyse the data to maximise and improve the placement of listings on Trade Me.
Insights is automatically turned off if you have more than 30,000 products.
The following outlines the areas of analysis.
Summary
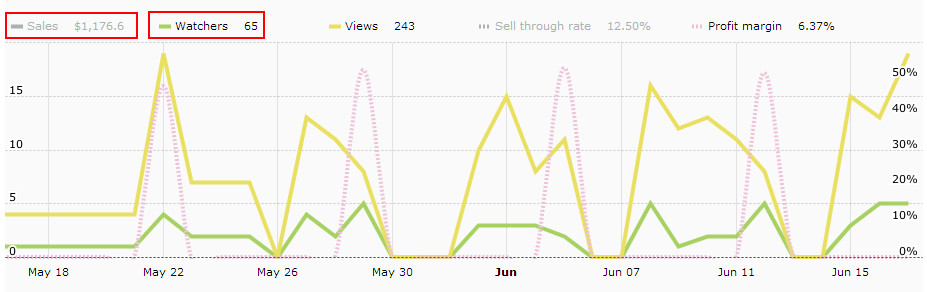
This dashboard type screen provides a quick overview of your recent sales, as well as your best and worst performing products.
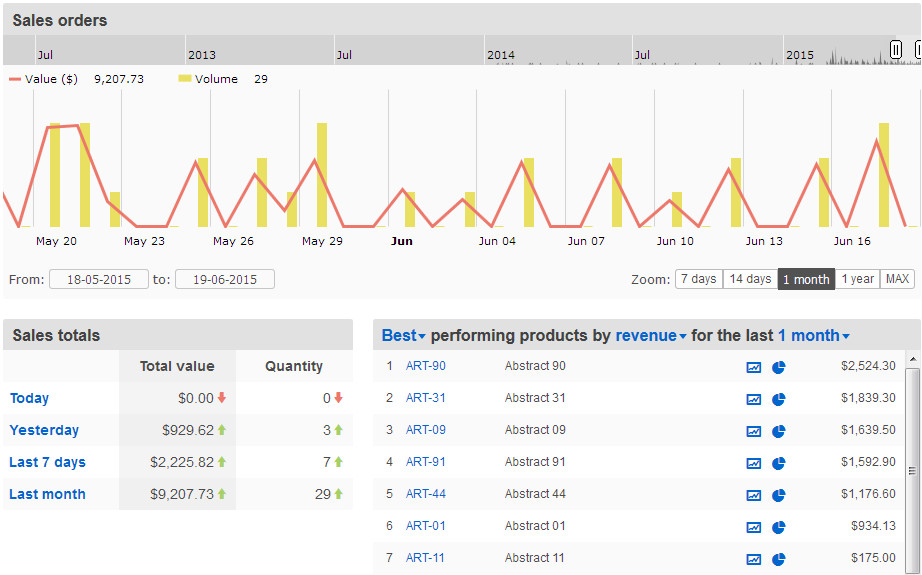 You can use the zoom date period buttons to change the date period that is being reported on. You can also use the period slider buttons in the chart header to also change the reported period. Note, some web browsers currently struggle with the date slider buttons and lag on the updating.
You can also target the worst performing products.
![]()
Product Analysis
The Product Analysis screen provides insight into the performance of your products on Trade Me.
You can filter by all your products, a specific product or a specific category.
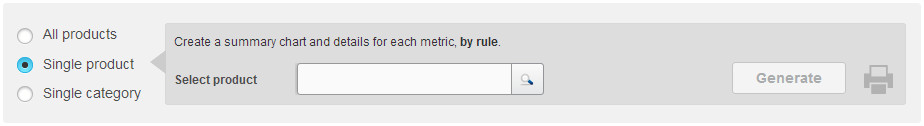
When selecting a specific product or category you will need to select the Generate button to create the charts.
When the product only has a solitary listing rule then the standard 3 charts will be displayed.
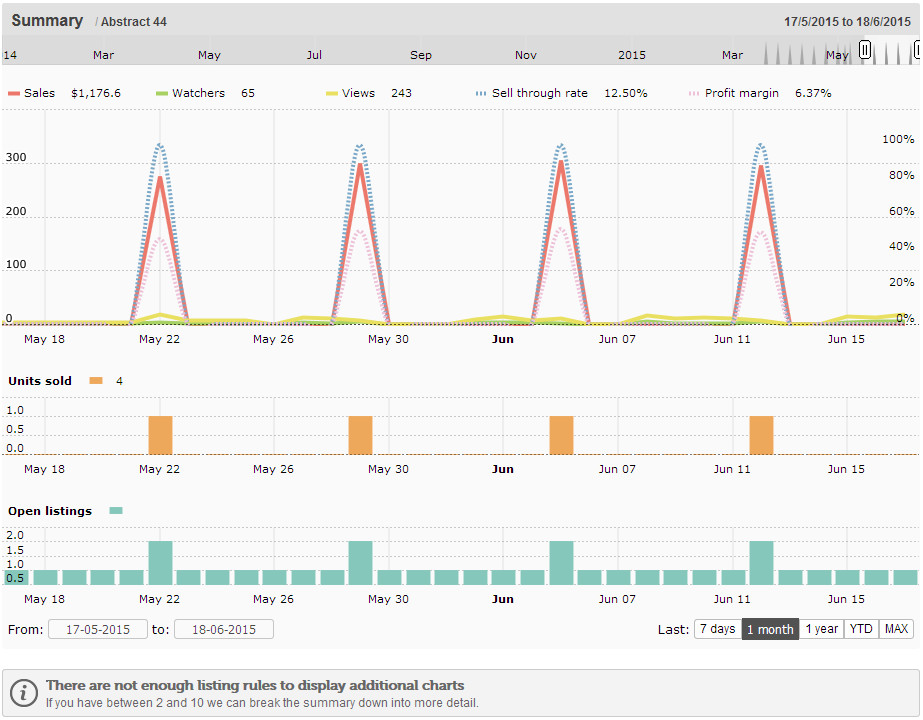
You can change the reporting period by using the zoom period buttons. Alternatively, you can drag the date sliders near the top of the topmost chart.
You can also toggle the items to be reported on by toggling the items in the legend across the top of the topmost chart.
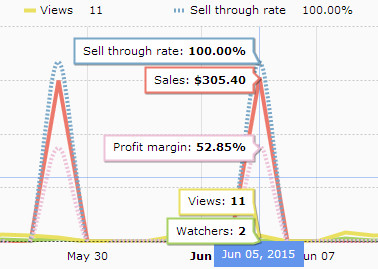
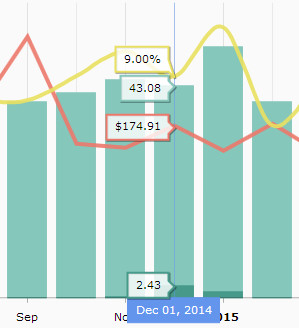
Mousing over the chart will display the daily statistics.
When your product has multiple listing rules (between 2 and 10) then additional charts will be generated for you. The additional charts report on open listing counts, units sold quantities, sales values, watcher counts and view counts. These charts track the counts and values for each listing rule for the product or category.
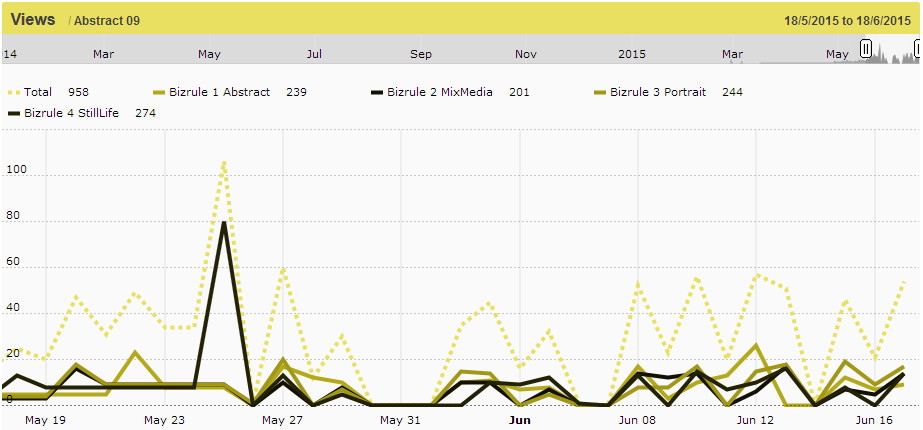 Again you can toggle the legend to show or hide the rules to report on.
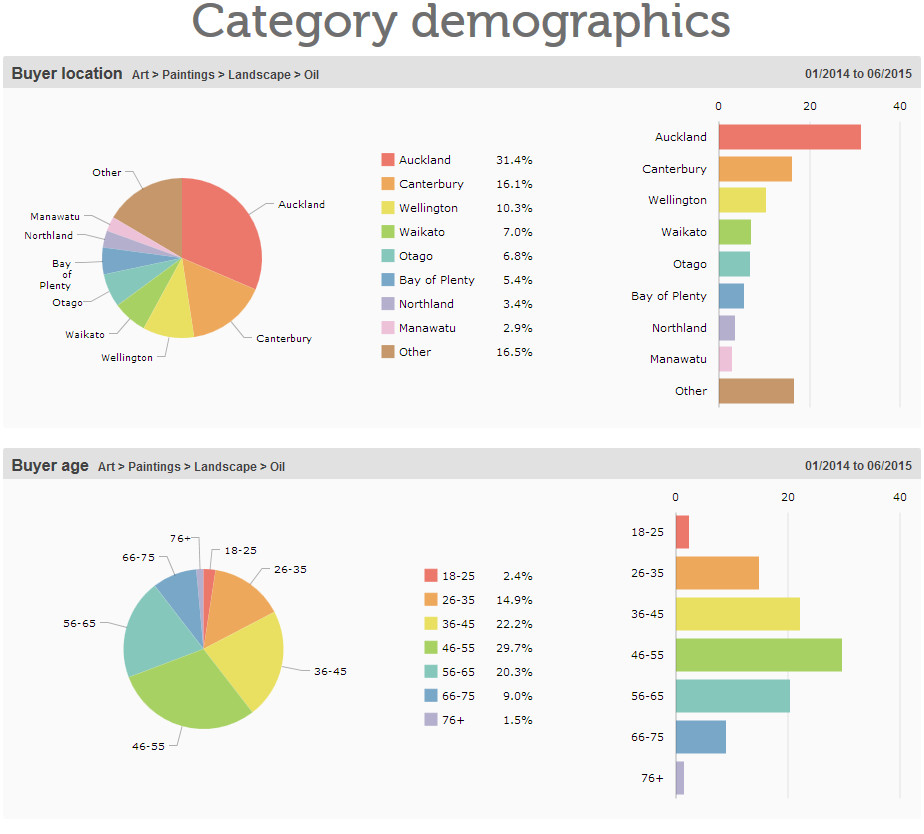
Market Comparison
The Market Comparison screen provides market demographics and comparisons for your products on Trade Me.
You can filter by a specific product in conjunction with either products in the same category or similar listings.
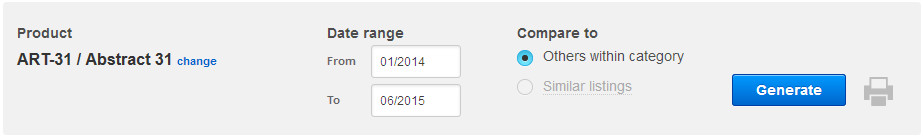
When selecting a product you will need to select the Generate button to create the charts.
If your product has multiple rules then you will be prompted to select the listing rule to target.
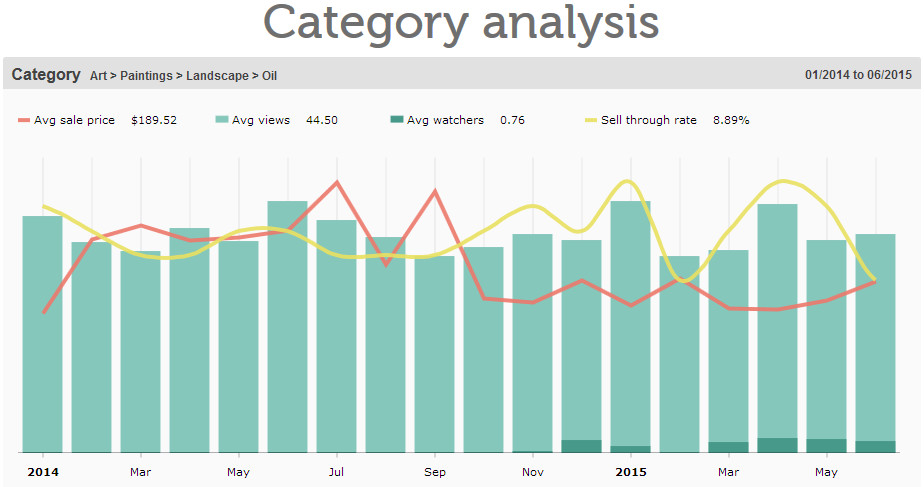
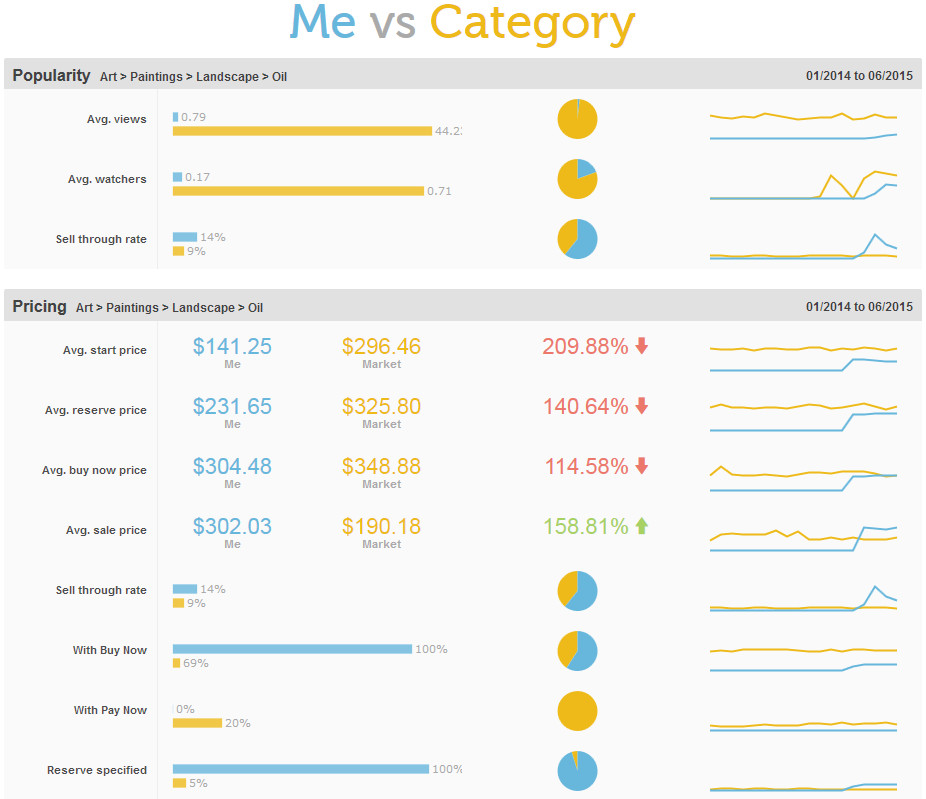
You can toggle the items in the legend to show or hide the items to report on.
Mousing over the category analysis chart will display the daily statistics.
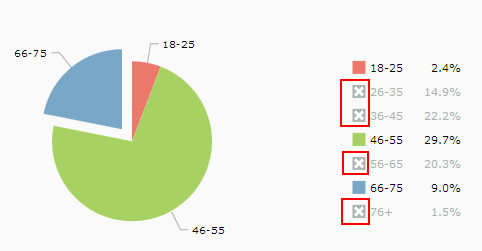
You can also show or hide items in the pie charts by toggling the items in the legend.